Infographics are a great tool for explaining complex information or data in a simple and engaging way. If you are having trouble explaining a complex process to an investor or maybe your amazing data isn’t exciting anyone but you, then you definitely need an infographic.
Infographics are reportedly 30 times more likely to be read than text* and if done correctly, an infographic can be worth a thousand words. That’s why infographics are such a great tool for pitch decks where time and space are limited.
I don’t know if you know this but there are actually three types of Infographics:
I’ll explain each one so that you know which one might work best for you in the future. Or if you would prefer, check out my video below.
Data visualisation
Data visualisation is pretty much what it sounds like; it’s an infographic that turns data into a graphic.
An infographic can be as simple as an image to highlight an important piece of data like this one, which illustrates a statistic of one in three people. It’s a nice solution and easily understood. And that is what we are looking for in a pitch deck.
An infographic can be as simple as an image to highlight an important piece of data like this one on the right, which illustrates a statistic of one in three people. It’s a nice solution and easily understood. And that is what we are looking for in a pitch deck.


No doubt you have seen this next kind of infographic in your travels (left). They are all over the web and are really useful in creating bite sized chunks of information people can digest easily. If you want to illustrate a lot of data in an engaging way, then you might like to try experimenting with this kind of infographic.
Now let me demonstrate you how an infographic works better than a graph or table.
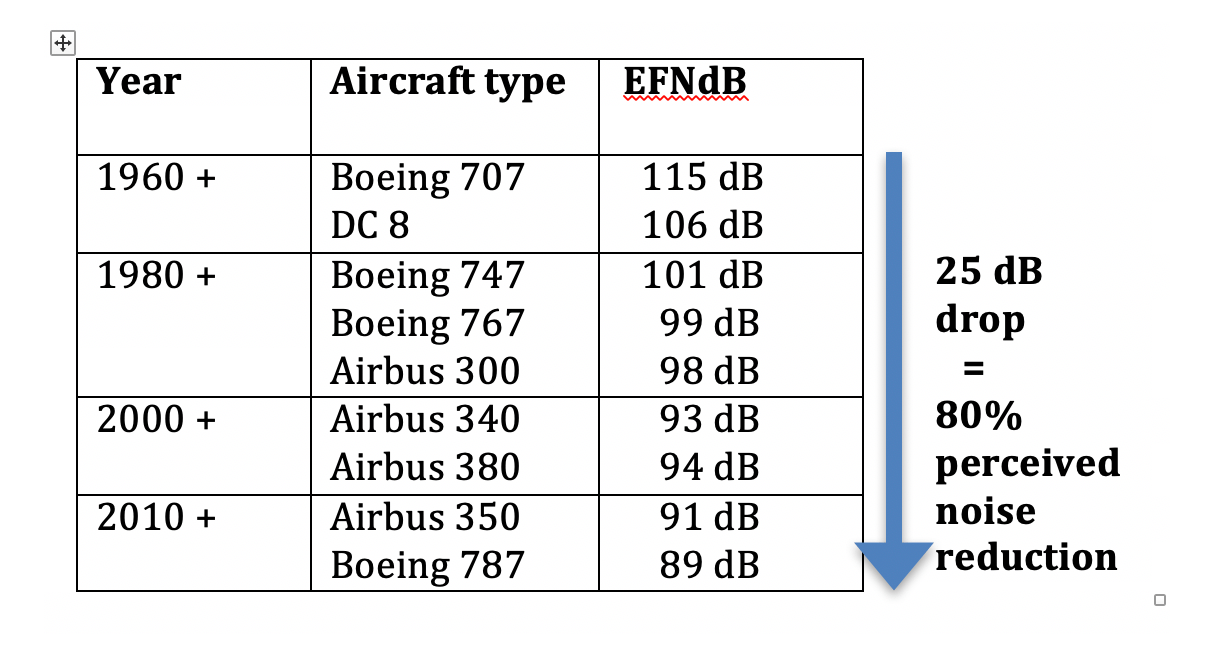
Here you can see a table supplied by a client to illustrate the aircraft noise reduction in jets. The data shown here doesn’t present their important point clearly. And in a pitch deck, that’s not going to work as won’t have time to explain to investors what these numbers really mean.
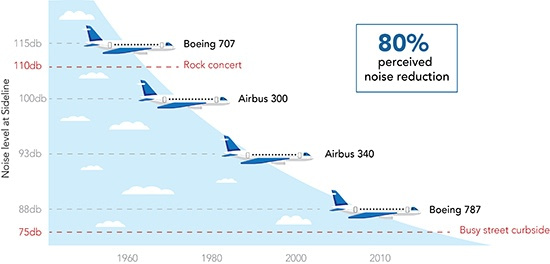
But when I create an infographic, this is where the magic happens. Suddenly the data is easy to understand and the point comes across at a glance.
That is the power of an infographic.
Creating Infographics isn’t rocket science. You simply need to look at your data and draw out the main message you are trying to make. If you are having trouble doing this, reach out to me.
Information Design
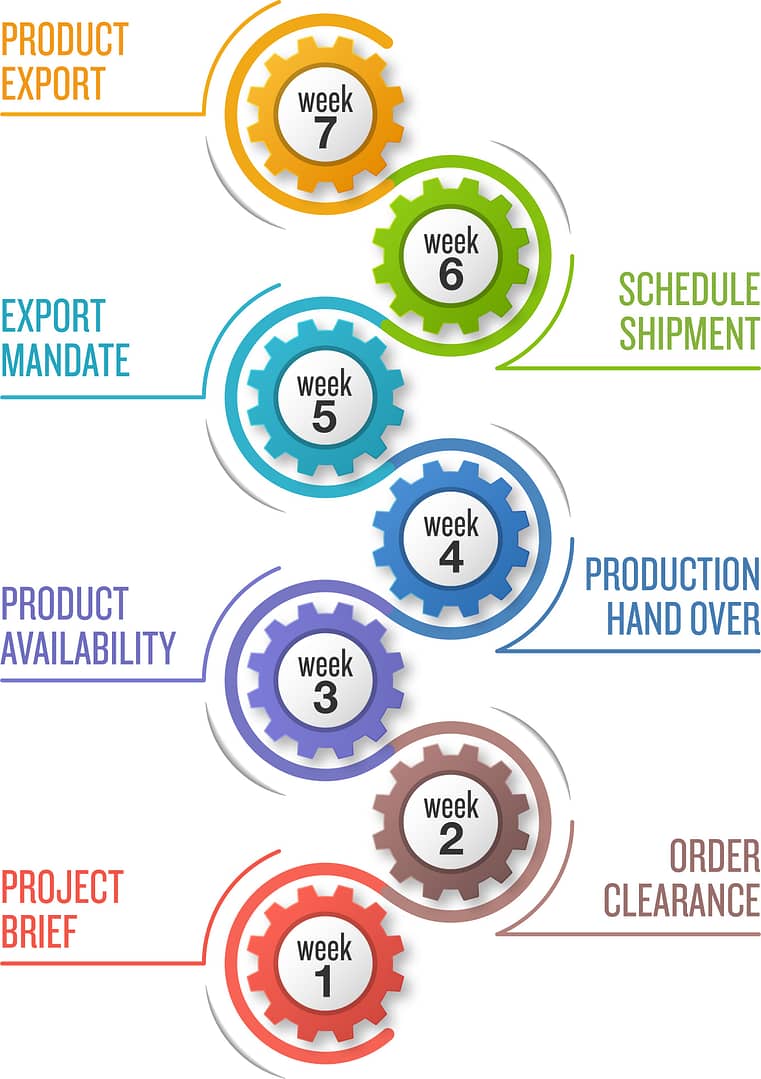
Information Design is brilliant for explaining a complex process so that people can make sense of it quickly.
Take a look at this sample and try to imagine how many words you would need to explain this development process. This infographic certainly does its job of creating clarity by making the process visual rather than verbal. Your investors will thank you if you can make your date more engaging like this.
Editorial Infographics
You don’t often see these in pitch decks as they are meant to be read; kind of like a visual story. They are a great option when you need to combine data, processes and chronology but they contain too much information for a single slide.
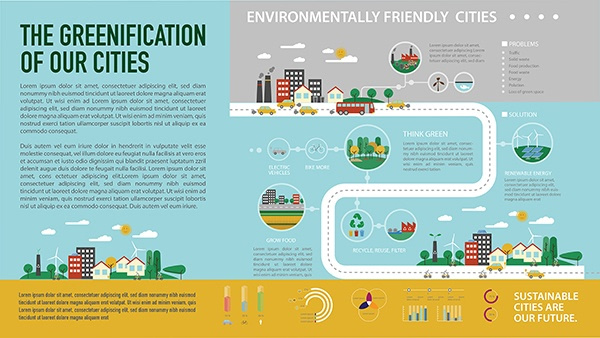
If you are using an infographic like this in your pitch deck, I strongly suggest you rethink your story and create a series of slides to build the message in stages. Pitch decks aren’t meant to contain content that needs time to be understood, they are meant to be a short crisp series of key points.
Each type of infographic serves its own purpose and can be a powerful storytelling tool.
If you are thinking about using an infographic in your pitch deck, then I suggest you get it underway as it can also be used on your website and in your promotional material. Making it an excellent investment.
Now you’ve seen how much clarity an infographic can bring to your presentation, the next question is, do you have all the key points that investors are looking for in your pitch deck?
DO YOU HAVE THE KEY POINTS INVESTORS ARE LOOKING FOR IN YOUR PITCH DECK?
Double check that you’ve got the 15 key points investors are looking for in your pitch deck by downloading my FREE pdf guide. You’ll find the link below. It's a great guide for the key points you need to cover in your pitch deck plus some tips on how to expand on those points. You don’t want to walk into a meeting without those 15 key points in your pitch deck.
Are you struggling to develop your pitch deck and need some help?
Creating a powerful pitch deck isn’t easy and let’s face it, sometimes you just need someone else’s opinion on whether you are on the right track.
Go to the website link in the description and upload your current presentation. I’ll take a look and let you know if your strategic message is on the right track or give you a quick guide on what could be tweaked to get the most out of your presentation.
Or if you need help with the design of your pitch deck, you’ll find four solutions there to suit every budget.
You don’t get a second chance to impress investors so getting your pitch deck right should be your primary goal.
Share this blog with people that matter to you.
